Before you begin: Complete Validating a container, Using the Index testing tool, and the Checklist: What must pass before a container can auto-deploy. This topic covers the naming convention, deployment notifications, and monitoring you'll use every time you deploy, not just during onboarding.
Deploying your image and model
Deploying your image and model is intended to be simple. Naming your artifact correctly and uploading it is the whole interface.
Your image tag and your S3 model folder name must both follow the naming convention described in Artifact naming conventions and deployment regions. The same convention applies to both artifact types. That page covers the version format, the optional annotation, and the optional region suffix (_AMS, _EMEA, _APAC) that controls which region or regions an artifact deploys to.
Images and models deploy together. A single sync deploys an image and its model together. They are coupled at rollout time. If you update only your image, your current model still gets redeployed alongside it, and vice versa.
Global deployments overwrite region-specific deployments. A global upload overwrites every region, including one which could be running a region-specific artifact. It is recommended that all artifacts stick to being either global or region-specific to avoid unintended overwrites.
Set up Docker Hub access
You share your container with Index through Docker Hub, and Index pulls from there. This is a one-time setup:
Create a Docker Hub repository for your container images.
Grant read access to
nexus@indexexchange.onmicrosoft.com.
Push an image
Important: Pushing an image triggers an automatic deployment. Only push an image when you intend to deploy it. If you do not want to deploy an image, do not push it.
Confirm your image is eligible to auto-deploy. See Checklist: What must pass before a container can auto-deploy for the three things that must be true: correct naming, a clean vulnerability scan, and the required endpoints.
Push your image. It is automatically detected, scanned for vulnerabilities, and deployed.
Note: Index Cloud generally completes deployment of a new image in under an hour. Factors that affect completion time include image size, targeted geographic regions, network activity, and timing within the synchronization cycle. You may monitor your deployment in Grafana on the Deployment Tracker dashboard in Dashboards under the Index Managed folder. For details on how to access Grafana, see Access your Grafana data.
Note: Bake all of your own configuration into your image. Custom environment variables are not supported, so a configuration change means building and pushing a new image. Chart changes, such as to your compute resources or pod shape, still require a manual deployment. Contact your Index Representative for those. See Holding back a deployment for the full list.
How a rollout progresses
Index deploys your container using Helm and Argo CD, into a dedicated Kubernetes namespace. You can download the Helm chart used to deploy your container. The chart exposes your container's API endpoints using host networking to reduce latency.
Every rollout is staged, and it evaluates itself against your live traffic rather than waiting for you to approve it:
A small set of instances running the new version (the test set) launches first and immediately begins receiving real requests.
Existing instances of the older version (the stable set) keep serving traffic alongside it. The total number of instances across both sets stays constant throughout.
If the test set performs within its latency SLA with an error rate below 3%, the stable set scales down proportionally as the test set scales up, until the test set becomes the new stable set and the rollout completes.
If the test set does not meet those criteria, the deployment is automatically rolled back.
This is why a bad image degrades rather than breaks your service: the older version is still carrying traffic while the new one proves itself. If you want additional checks beyond SLA and error rate included in the rollout evaluation, contact your Index Representative to discuss adding them.
Your first deployment
Your first deployment runs as an initial trial on a baseline resource allocation, so you can validate against production traffic before committing to a production footprint:
| Parameter | Value |
|---|---|
Deployment region | US, Europe, APAC (based on your traffic needs) |
Baseline allocation | 80 vCPU / 120 GB RAM total |
Duration | Up to 90 days |
After the trial, Index works with you to confirm your target QPS Queries Per Second (QPS). The number of bid requests a DSP processes per second. Also known as impressions per second. profile and provides a production resource recommendation and pricing based on your observed workload behavior. See the Onboarding process section in Welcome to Index Cloud for how that fits into the wider onboarding path.
Note: Auto-deployment applies to every account. Once your image clears the checks in Checklist: What must pass before a container can auto-deploy, pushing a new image tag deploys it. You do not need to give notice, raise a request, or limit how often you deploy.
Monitoring your deployment
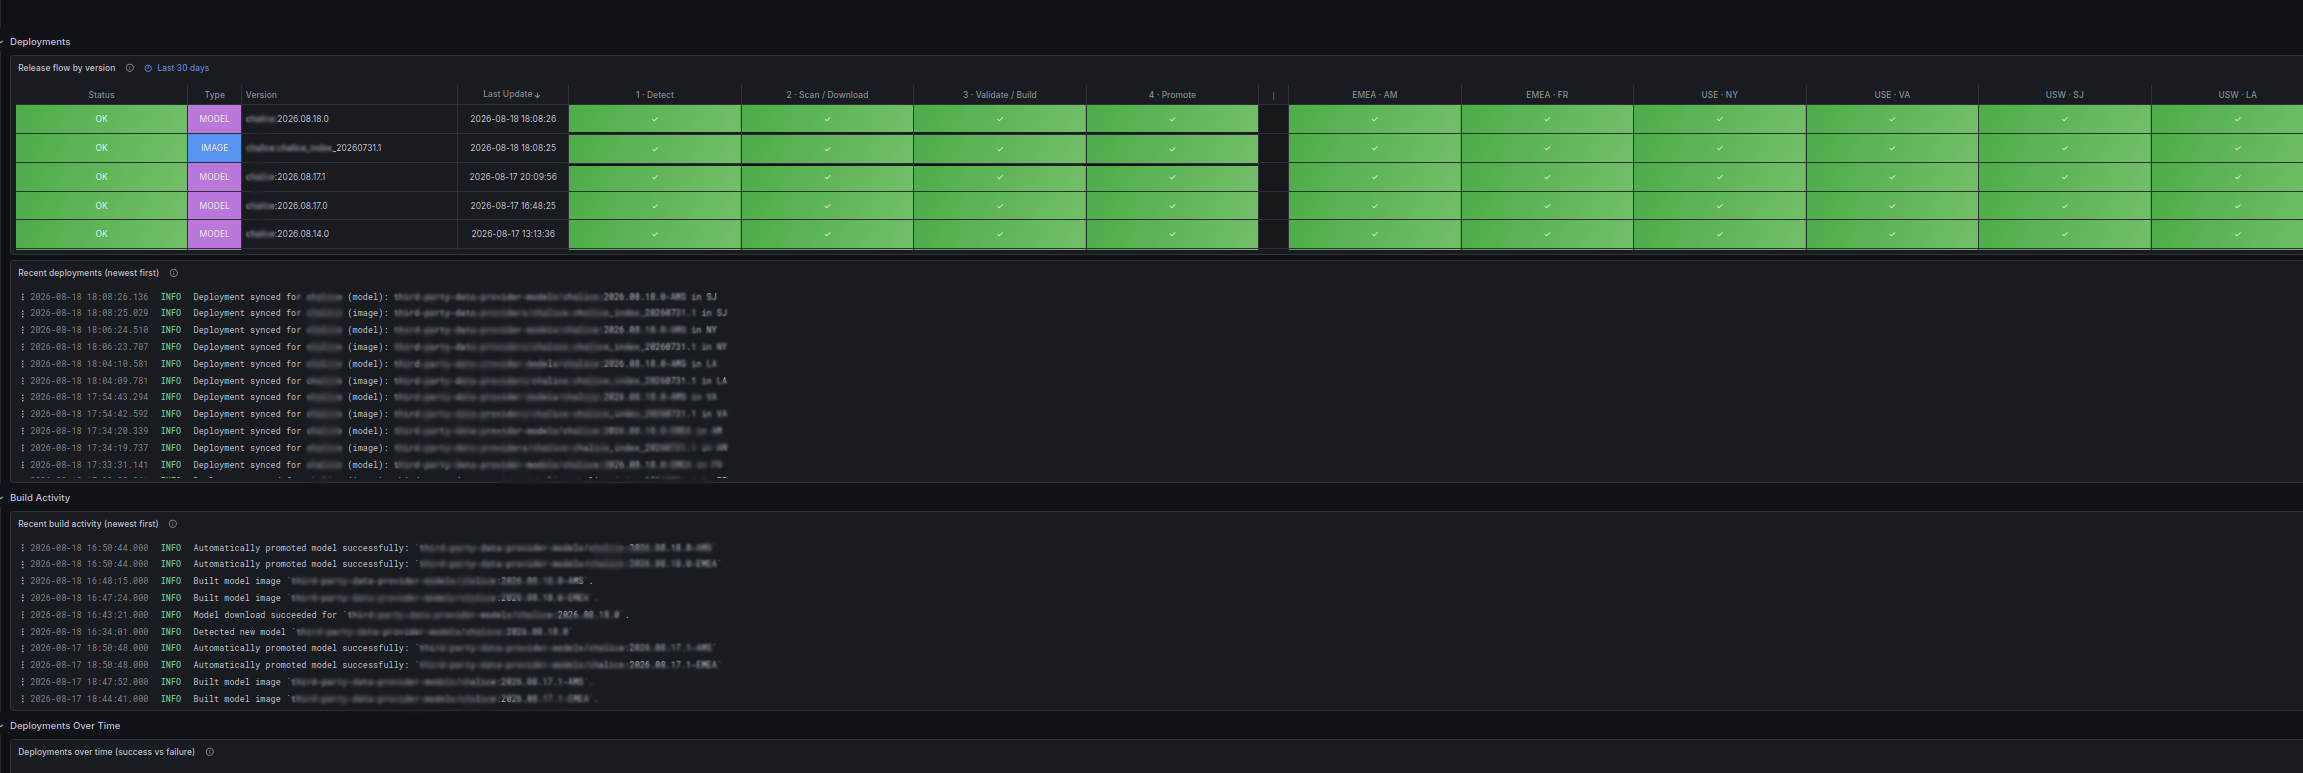
You can follow your deployment's journey through Index Cloud in Grafana in the Index Managed folder in the Deployment Tracker dashboard, which visualizes logs recorded as your change is processed by Index. For details on how to access Grafana, see Access your Grafana data.
"Rolled out" means a release was applied to a datacenter. It confirms the rollout was accepted there. It is not a health signal. Check your application metrics for health status.
The visualization shows the overall status of a deployment, whether something has gone wrong, and where it's at in the deployment process.
The following shows a successful rollout. Index's checking extends up through the datacenter rollout itself. Once your service starts in production, Index confirms its health check and readiness endpoints report healthy. See the Orchestration endpoints section in Building a Docker container. Once every targeted datacenter box goes green, as shown in the example below, the deployment is complete and successful from Index's side. Index has not changed anything infrastructure-side during the rollout, so if a datacenter box shows red after Promote, it is very likely something in your own change rather than an issue on the Index-side.
From that point on, you're in the realm of monitoring, not deployment. It's up to you to monitor your own health, logs, and metrics and decide whether your change is behaving the way you want. Index does not make that call for you. See Access your Grafana data for how to set that up.
The following shows a rollout that failed during the Validate/Build phase.

There is also a Currently Deployed panel, which shows which artifacts have been most recently deployed to each datacenter. It shows the most recent successful attempted deployments that have made it to each datacenter, and failed ones that are newer than the most recent successful one.

Notifications and alerting
Index provides optional deployment lifecycle notifications to a shared Slack channel, #partner-index-external-notifications. These are push-notification supplements to the monitoring available in Grafana. Grafana remains the source of truth if a message is missed or its wording changes.
The exact format and wording of these messages may change over time.
Image notifications
| Notification | What you'll see | What you need to do |
|---|---|---|
Image Detected |
| No action needed. Confirms Index has detected your newly pushed image and is starting the deployment pipeline. SDLC logs and visualizations for this pipeline are available in Grafana under Dashboards > Index Managed. |
Deployment Requirement Check Performed |
| Success: none. Failure: components within your image require updating or change. A list of these components is logged in Grafana. Contact your Index Representative if you believe this is a false positive. |
Test Validation Performed |
| Success: none. Failure: your image did not pass validation, for example because its health check or metrics endpoint |
Deployment to Datacenters Started |
| Deployment will begin within 5 minutes of this message. Confirm in the Deployment Tracker dashboard that the rollout completed, and check your application metrics and logs for health afterward. Duration of the deployment will vary depending on your container's startup behaviour, size, and amount of containers. Contact your Index Representative if no deployment follows. |
Deployment to Datacenters Partially Started (Frozen Regions) |
| Deployments may be paused in specific regions to protect Index infrastructure during an incident or planned maintenance. Contact your Index Representative to be notified once deployments resume in the affected regions, if this hasn't already been communicated. |
Deployment to Datacenters Skipped (Frozen Regions) |
| All target regions are currently frozen from deployments, so no deployment occurred. Contact your Index Representative to be notified once deployments resume, if this hasn't already been communicated. |
Deployment to Datacenters Failed (Other) |
| Index-side issue with deployment. Should not occur. Contact your Index Representative. |
Model notifications
| Notification | What you'll see | What you need to do |
|---|---|---|
Model Detected |
| No action needed. Confirms Index has detected your newly pushed model and is starting the deployment pipeline. |
Model Download Pass/Fail |
| Success: no action needed. Confirms Index has downloaded your newly pushed model. Failure: confirm the model is available and has the proper permissions set. Contact your Index Representative if you believe the issue is on Index's side. |
Deployment to Datacenters Started |
| Deployment will begin within 5 minutes of this message. Confirm in the Deployment Tracker dashboard that the rollout completed, and check your application metrics and logs for health afterward. Duration of the deployment will vary depending on your container's startup behaviour, size, and amount of containers. Contact your Index Representative if no deployment follows. |
Deployment to Datacenters Partially Started (Frozen Regions) |
| Deployments may be paused in specific regions to protect Index infrastructure during an incident or planned maintenance. Contact your Index Representative to be notified once deployments resume in the affected regions, if this hasn't already been communicated. |
Deployment to Datacenters Skipped (Frozen Regions) |
| All target regions are currently frozen from deployments, so no deployment occurred. Contact your Index Representative to be notified once deployments resume, if this hasn't already been communicated. |
Deployment to Datacenters Failed (Other) |
| Index-side issue with deployment. Should not occur. Contact your Index Representative. |
If a deployment doesn't behave as expected, or you have questions, reach out to your Index Representative or post in #partner-index-external.
Next steps: To watch how your container performs now that it is taking traffic, see Monitor your performance and Access your Grafana data. To iterate on model data without redeploying your container, see Updating models in containers without rebuilding. For details on the samples of your live traffic that Index deposits for offline analysis, see Auction data samples in your Amazon S3 bucket.
